Health charts
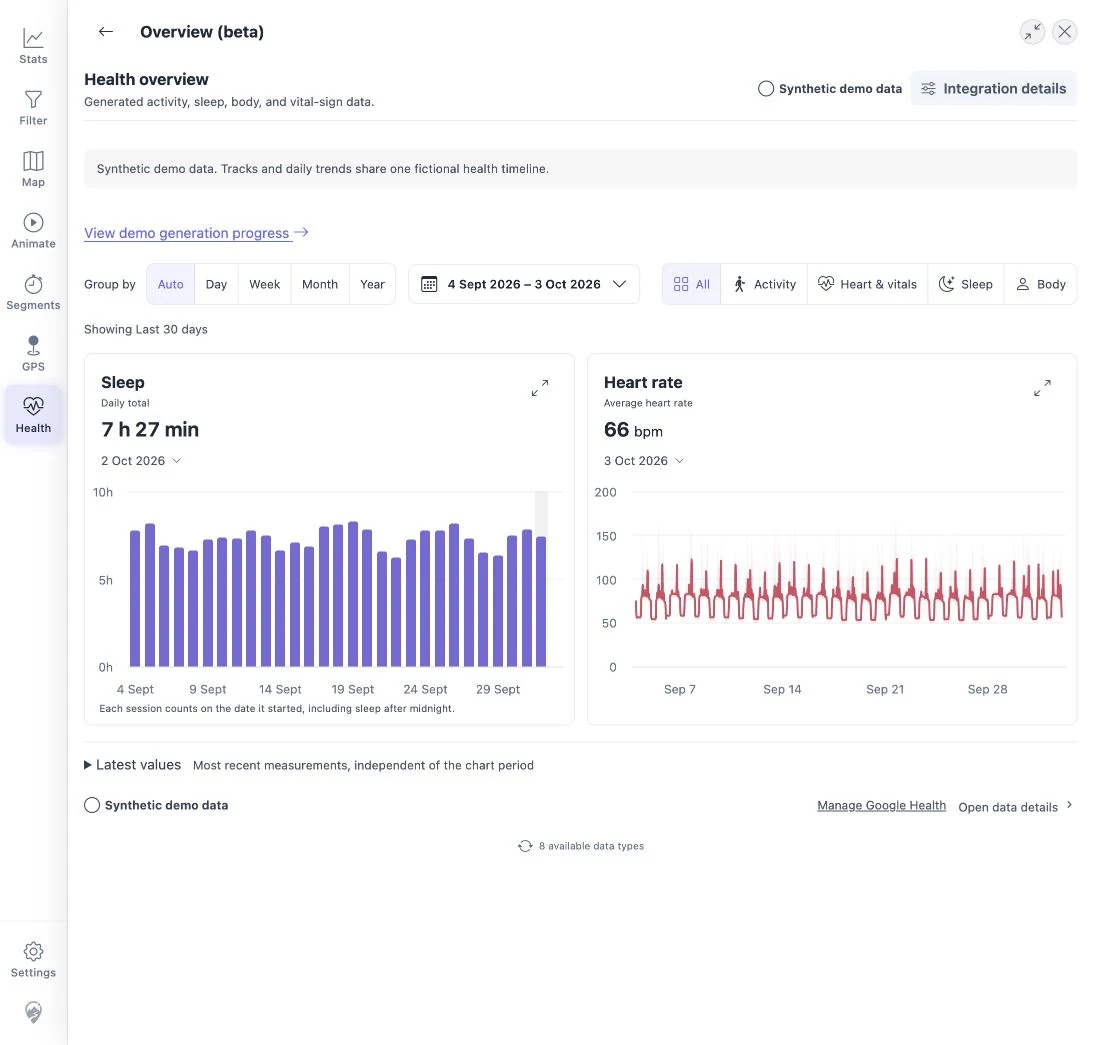
Open Health from the navigation, or More → Health on a phone. Choose Overview for charts or Data & Records for the raw data. Back returns to this choice.
On this page
Use the charts
- Choose a date preset, or set your own range and click Apply.
- Choose the grouping: Auto, Intraday, Day, Week, Month, or Year. Weeks start on Monday.
- Point at a bar, or click or tap it, to see details for that period.
- Activity charts show totals or daily variation.
- Sleep is counted on the day it started, including naps. A night is not split at midnight.
- Measurements show averages, and optionally the range of values.
- Expand a chart for more room; Back or Escape returns.
- Latest values shows your most recent values, which can be outside the selected dates.
Chart preferences are saved in this browser.
See readings within a day
- Choose Intraday under Group by in Overview, or open a day's details on a daily chart and choose See day in detail.
- Choose a day, or use the arrows to move between days.
- Choose a time window above the charts, such as 1 h or 15 min, and use the arrows beside it to move earlier or later. You can also drag or pinch on any graph. All graphs show the same time window.
- To enter exact times, choose the time range, set From and To, and choose Apply. For example, enter 12:00 and 12:15.
- Select a point to mark that time on every graph and see each reading. Full day shows the whole day again.
Each point shows the average for one second. Average & range also shows the lowest and highest readings in that second. A break in the line shows a time without readings.
Intraday detail is available for heart rate and timestamped weight, body fat, body temperature, and blood glucose measurements. The detail depends on what your device recorded and Google supplied. Choose Day or a coarser grouping for daily totals and other daily measurements.